Low Ceremony Architecture
Below is the abstract that I submitted as a presentation proposal for the Software Engineering Institute‘s SATURN 2011 conference.
Measuring Software Productivity
An interesting Twitter conversation I had with Martin Fowler yesterday.
Martin: Just ran into a request to measure productivity of software projects using Line of Code per hour. *sobs* #zombieswontdie
Me: @martinfowler But software productivity IS measurable, in context. http://bit.ly/9ZqidP
Martin: @sjcarriere I disagree: http://www.martinfowler.com/bliki/CannotMeasureProductivity.html
Me: @martinfowler I expected. 🙂 I believe there are meaningful measures that we can use to improve productivity within the software process.
Martin: @sjcarriere true, but that’s very different to saying you can measure productivity itself.
Me: @martinfowler You have to measure something to improve it. For software productivity, it starts with the long-term value of the output.
(Aside: there’s got to be a better way to transcribe Twitter conversations…)
Keyboards
I’m a keyboard junky. I have dozens. I sometimes switch between keyboards multiple times during a single day. Yes, it’s a problem.
Here are my four favorites. Clearly, I like the tactile feedback of clicky keyboards:
- IBM Model M – the most obnoxious for my neighbors, but with the best feel ever. Unusable if you have a headache. One of two keyboards on my list with a Wikipedia page.
- DAS Keyboard Professional – came second because I think the keyclick is a bit high-pitched, and my spacebar squeaks. I don’t need the key labels, but I’m not geek enough, I guess, to go blank.
- NMB RT8255C – good click, solid. This keyboard is so obscure I couldn’t even find something to link to. I came across this keyboard at a business center in the Albany airport, and it took me several years to find one (I bought two, actually). My one complaint is the weird placement of the backslash key, in the top row, left of backspace.
- Kinesis Advantage – something completely different, for when the clicking gets to be too much, or my wrists start to hurt. I’ve got the cool Qwerty/Dvorak one, just for the key labels. I’ve been typing Dvorak for 20 years, and this is my first and only Dvorak-labeled keyboard.
And the runners up:
- Microsoft Wireless Entertainment Desktop 7000 – love the action, hate the F-keys.
- Dell AT101 – the “Black Alps” switches are quieter than the “buckling spring” switches in the Model M, and I find the keys a bit “loose” – they rattle.
Finally, the ones you can’t pay me to use:
- Logitech MX3200 – totally flat, uninspired. Not sure why I bought it.
- The new Apple Keyboard – I don’t even know where to start.
Just thought I’d share.
It’s pronounced like “lamb”, not like “lame”
With that out of the way, it’s time for an update on the Lightweight Architecture Alternative Assessment Method (if you’re judging – negatively – the quality of the acronym, you wouldn’t be the first), which I first blogged about four years and three jobs ago. Since then, LAAAM has undergone some refinement, shaped by collaboration and experience in its use at Fidelity and VistaPrint. This week is Microsoft TechEd, and I’m giving a presentation on LAAAM this Tuesday at 10:15AM: ARC314. I’m also doing a Tech Talk Interview with Bob Familiar on Thursday.
Why do LAAAM?
The first question should actually be: “why evaluate architectures?” Generally speaking, analyzing architectures gives us an opportunity to make good decisions early in the software development lifecycle, reducing risk and improving the quality of what we deliver. This benefit is possible because architectural decisions – the earliest decisions in a system’s life – are the primary determiners of quality: performance, scalability, reliability, flexibility, and so forth. Unfortunately, the state of the practice in making architectural decisions is most senior/loudest/most patient debater wins. Sometimes this produces good decisions, but it’s not very predictable or repeatable, and we don’t usually end up with a clear and documented rationale.
LAAAM’s first, and perhaps most important, contribution to the software development lifecycle is its focus on defining what quality means for a given system or product. The "–ilities" are commonly used, coarsely, to talk about architectural quality, and they usually give us a nice warm-and-fuzzy; who wouldn’t want a system that exhibits scalability and reliability and flexibility and maintainability?
The second important contribution of LAAAM is the way it brings together stakeholders – i.e. anyone that cares about the outcome of a decision – from the business,the development team, operations, QA, etc. LAAAM helps achieve a common language and decision framework. LAAAM helps to build consensus. That doesn’t mean everyone has to agree on everything, but it does mean that everyone’s perspective is on the table and the final result represents a fusion of those perspectives into a rational whole.
Finally, LAAAM produces a set of artifacts that represent a rigorous, rational decision-making process. These artifacts are extremely valuable in justifying architectural decisions; yes, ideally all of the stakeholders in those decisions would participate in the process as described above, but obviously that’s not always possible. So the LAAAM artifacts give us a way to express the reasoning that went into a given decision, with a foundation in the definition of quality for a system.
Quality
The first, and most important, step in LAAAM is to figure out what quality means for a given decision. In other words, when all is said and done, and we look back on the decision, what’s going to make us say “that was the right decision”? The –ilities give us a starting point, but they’re not enough. LAAAM takes a page from the ATAM playbook here, and has us build a quality tree (ATAM calls it a utility tree, and LAAAM used to, but the term confused people) to structure our thinking. This is easiest by example:

Here, performance (an honorary –itility) and maintainability are the two important quality attributes for whatever decision we’re trying to make (yes, there are always more than two in the real world). Performance has been refined to have two sub-qualities: response time and scalability. You get the idea.
Scenarios
Now the punch line. LAAAM doesn’t let us stop here, but rather forces another level in the tree: scenarios. Scenarios (also borrowed from ATAM) give us the mechanism to be precise in defining quality, by ensuring each of our quality attributes are refined to a point of measurability. In other words, we can look at the alternatives we’re considering and assess how well they achieve a scenario. You can’t do this when you stop at “flexibility” or “scalability’”. Scenarios have a consistent structure: a context, a stimulus and a response. The context is the state of the environment when the scenario is applied, the stimulus is something happens to the system, and the response is how we want the system to react. Again, by example:

A couple more:
- The system network is partitioned and restored to normal condition; complete database resynchronization occurs within 30 minutes.
- For a new release, integrate a new component implementation within two days.
The context/stimulus/response identification is left as an exercise (hopefully trivial) for the reader. But note that the last example is different from the first two: it doesn’t apply at run-time, but rather at development time.
(Sidebar: while I’ve presented this a top-down exercise – first level quality attributes, second level quality attributes, scenarios – it’s not always done this way; in fact, it’s probably rare. More often, the quality definition comes cyclically – you start with a few first level quality attributes that you think are important, someone throws out a scenario or two, you add some second level quality attributes to group them, and so on. LAAAM doesn’t insist on any specific approach to building the quality tree, so long as it gets done.)
Now, let’s put some scenarios into our example quality tree:

Great, I want it all! But wait …
Knowing What’s Important
Unfortunately, quality attributes trade off against one another. There come times when you have to choose to achieve versus another, and it’d be nice to know in advance how to know which to is the right one. In the most general case, we could try to weight all of our scenarios, but this is really hard, especially when trying to get people with competing concerns to agree. Instead, LAAAM follows an approach of ranking at each node in the quality tree, like so:

So performance is more important than maintainability, scalability is more important than response time, and the steady state scenario is more important than the peak load scenario. Easy, right? Everyone’s happy to agree? Not always, but at least we we have a much more constrained series of problems to solve, rather than trying to tackle one big problem. Sometimes you have to resort to tricks like voting to get to closure, but I’ve seen this be pretty rare.
Scenario Weights
The next step is completely mechanical. Using a formula called “rank order centroids” ROC, we compute a weight for each scenario. I came across ROC in an MSDN Magazine Test Run article called “Competitive Analysis Using MAGIQ”, but it originated with Barron and Barrett’s 1996 paper “Decision Quality Using Ranked Attribute Weights”. Anyhow, ROC computes a weight for a given ranking like this:

Where N is the number of options and k is the rank. So above, flexibility was ranked 2 out of 3 options:
 If you’re thinking “wow, this really favors the highly ranked options”, you’re right – that’s the point. The idea is that this is, psychologically speaking, how people actually apply importance to rankings. There’s lots of interesting other work in this area. Check out: Attribute Weighting Methods and Decision Quality in the Presence of Response Error: A Simulation Study.
LAAAM isn’t wed to rank order centroids, and sometimes we use linear, or even manual (danger, Will Robinson) weightings at one node in the utility tree when the stakeholders decide it’s more reflective of the actual relative importance of sub-qualities or scenarios. Rank order centroids has proven pretty effective though, so it’s the default. Whichever approach you use to determine the weight for a given ranking, the last step is to compute the product of the rankings for each path through the utility tree, to come up with the scenario weights:

So the steady state scenario has a total weight of .140625 and the peak load scenario has a total weight of .046875. Nothin’ to it.
Alternatives
Excellent, now we’ll know what we like when we see it. The next step is to figure out what the choices are – what are the alternative decisions, solutions, platforms, whatever, that we’re trying to choose among. But first, note that all of the work we’ve done up to this point (i.e. creating a fully ranked quality tree with scenarios) is completely independent of the decision itself – this makes it much more persistent through time, even able to outlive a single instantiation of a system.
Generally, compared to defining quality, it’s pretty easy to identify our alternatives; usually the participants in the process have a pretty good idea about the options – .NET or Java or Ruby? On-premise or in the cloud? Hibernate or iBATIS? Entity Framework or LINQ to SQL or NHibernate? SharePoint or Documentum? The common challenge at this point isn’t in identification of the alternatives, but in defining them to a sufficiently precise degree that we can assess them. Sometimes this means we have to do more investigative work during the LAAAM process, but the scenarios guide us to where this investigation is required.
Assessment
Finally, we get to the third A in LAAAM – Assessment. Somewhat counter-intuitively, this part is actually the easiest. All we need to do is fill in this table:
|
Scenario |
Alternative 1 |
Alternative 2 |
Alternative 3 |
| Scenario 1 | |||
| Scenario 2 | How well does alternative 2 achieve scenario 2? | ||
| … |
Each cell will contain a very simple assessment measure: usually we use a scale like poor, fair, adequate, good, excellent. This part of the process is done collaboratively with the subject matter experts for each of the alternatives, plus whatever additional supporting players are required. Comparing alternatives is fine; in fact, it commonly makes the process go very quickly when you can establish a firm baseline (usually with the alternative that’s best understood) and ask questions like “is this solution better or worse?”
Now turn the ratings into numeric values (it doesn’t matter what they are, as long as they’re linearly distributed), multiply each by the weight, and you’re done (d’oh, I just realized the math in my TechEd deck is wrong):
|
Scenario |
Weight |
Alternative 1 |
Alternative 2 |
Alternative 3 |
| Scenario 1 | .140625 | Poor (0) | Fair (1) | Excellent (4) |
| Scenario 2 | .046875 | Good (3) | Adequate (2) | Fair (1) |
| Total | .140625 | .234375 | .609375 |
(Footnote: if you read my earlier blog on LAAAM, you’ll notice that each cell actually contained three assessment “dimensions”: fit, development cost and operations cost. Repeated application of the method made it clear that cost is almost always smeared across the scenarios in a way that makes asking about it in each cell very difficult. Effectively incorporating cost back into the method is an important subject for future work, but it hasn’t inhibited adoption yet.)
Final Analysis
Unfortunately, we don’t get to simply declare that Alternative 3 is the winner, even though it had the highest score. We do have an ordering of our alternatives, and we can get an idea about their relative adequacy. To be thorough with the method, though, we need to ask a question about sensitivity: which scenarios are heavily weighted and exhibit significant differentiation among the alternatives? These are the important ones, where we want to be sure about our assessment. A second pass to validate sensitive scenarios is a good follow-up.
Also, in cases where a narrow margin exists between highly-rated alternatives (e.g. when they’re within 20%), one approach to refining the analysis is to add scenarios to further differentiate the alternatives. One way to do this is to decompose sensitive scenarios into sub-scenarios to probe related concerns. Sometimes it’s necessary to refine the definition of one of the alternatives and iterate on the analysis; such refinement may require, for example, a proof-of-concept implementation.
Tool
At TechEd I showed a demo of the Quality-Oriented Decision Assessment (QODA) tool, developed by Gary Chamberlain, the lead for Platform Architecture here at VistaPrint. Although it’s pretty new, there’s already plenty of evidence that adoption of the method (which we’re now calling QODA inside VistaPrint) is substantially assisted with this tool support. Previously the only “support” was an Excel spreadsheet, which was painful to work with. The tool isn’t currently generally available, but we’re hoping to make it so sometime soon. Stay tuned.
Lessons learned
I believe every developer and architect should keep track of their personal "lessons learned" for software/process/organization design and, broadly, how they practice as a software professional. Further, I expect that I’m like a lot of other architects in doing so somewhat irregularly, and therefore almost certainly retreading and relearning more than necessary. So what better place to capture my lessons learned than here?
I actually made a first pass at this, somewhat sideways, as part of a talk called "An Architecture Journey" I gave at the SATURN conference at the Software Engineering Institute in 2007. The abstract and slides are posted. The gist of the talk was to share lessons I had learned during my various jobs as a developer and architect, along with some observations on how my definition and practice of software architecture evolved over that time. I gave a slightly perturbed version of this talk at Google Canada in Waterloo, where my good friend Steve Woods is the site director. Below are some of the lessons I came up with, paraphrased, and in chronological order. Sure, these don’t really stand on their own (and some may be downright cryptic), so the more interesting ones will likely become posts of their own.
Nortel
- Big systems are tough to get right; thinking about “architecture stuff” up front is required for success (like avoiding measuring time-to-dialtone in minutes after a major system reengineering effort).
SEI
- Architecture is the bearer of quality, but reasoning about architecture is reasoning about potential.
Quack/AOL
- Enabling autonomy of organizations and systems is the way you scale.
Microsoft
- You don’t need to choose between reasoning top-down and bottom-up: do spiral.
- You’ll rarely (never?) know in advance if a decision is right, but make sure you know afterward.
- Technology doesn’t matter (much); it’s about the people, the process, and the consistency of practice.
Fidelity
- Figure out who defines goodness of your work and make them happy.
- Don’t let “pragmatism” become a disguise for shortsightedness.
- Communication and understanding trump every technical problem.
- Plan for technology retirement, not just adoption.
VistaPrint
- Don’t boil the frog with standards. (As the most cryptic, there will definitely be a post coming on this one.)
- Be dumb. Ask smart questions.
- Don’t undervalue slack.
- Don’t forget your lesson about autonomy: define boundaries and common language when crossing them.
I’m currently particularly excited about the autonomy and slack lessons (not coincidentally the last two on the list), so expect posts on them before too long.
Technogility!?
Maybe this should have been the first post on my new blog, but I didn’t want to show any (overt) signs of mental weakness too soon.
The totally bogus pseudo-word "technogility" was one of those that jumped into my head and blocked any rational thought about better alternatives (that reminds me: go read Pragmatic Thinking and Learning: Refactor Your Wetware, if you haven’t already). My only excuse is that somehow, at least to me, the word has an intuitive connection to how technology enables business – specifically the topic I think is most important to our industry (and the subtitle of this blog).
Technology organizations are always challenged to continue to deliver value to their business partners (i.e. the proxy for the end customer, trying to figure out what they want), particularly as both the technology organization and their partners scale. Sometimes they scale differently, and sometimes the scaling is transformational – that is, one of the organizations has to radically restructure in order to continue to deliver. Agility is therefore fundamental, and brittleness is the enemy. When we create cultures, organizations, processes, tools, frameworks, etc. that are rigidly aligned to a particular mode of delivery, we put the entirety of the business at risk.
Talk at TechEd 2009
I’ve had a talk on the Lightweight Architecture Alternative Assessment Method accepted for the Architecture track at TechEd 2009. Here’s the abstract:
Making good architectural decisions, fast!
This session will present and demonstrate the Lightweight Architecture Alternative Assessment Method (LAAAM), a fast and efficient way to make good architectural decisions – decisions that are aligned with the needs of your business. Making good architectural decisions early in the software development lifecycle helps reduce project risk and ensures that precious time and energy isn’t wasted delivering solutions that miss the mark. This is critical in our ever-accelerating software development world. LAAAM’s most unique characteristic is its focus on defining what quality means for a given system or product. We all want to create high-quality products, but LAAAM helps us go further in determining the aspects of quality that are important to the stakeholders for a given system. The "-ilities" are commonly used, coarsely, to talk about architectural quality; however, LAAAM won’t let us simply say "my system has to be scalable" or "I need flexibility". Instead, LAAAM forces us to be a. precise in the kinds of scalability and flexibility that are important; and b. prioritize these quality attributes so that appropriate tradeoff decisions can be made. LAAAM produces a set of artifacts that represent a rigorous, rational decision making process. These artifacts are extremely valuable in justifying and communicating architectural decisions, since it’s rarely possible (or even desirable) to have every stakeholder involved in every conversation. The LAAAM artifacts give us a way to express the reasoning that went into a given decision, with a foundation in the definition of quality for a system. LAAAM has been successfully applied to make decisions large and small at Microsoft, Fidelity and VistaPrint. LAAAM draws its roots from the Architecture Tradeoff Analysis Method developed at the Software Engineering Institute at Carnegie Mellon University.
Simple Architectures for Complex Enterprises
Last Wednesday I attended a meeting of the New England chapter of the International Association of Software Architects, where Roger Sessions, CTO of ObjectWatch, gave a great talk based on his “Simple Architectures for Complex Enterprises” book. (I bought the book during the talk using the Amazon iPhone app … the last thing I needed was more enablement to buy stuff from Amazon.)
Below are my raw notes. Anything annotated “Thought” is something I was thinking, but didn’t say; generally I haven’t edited these, so some are addressed later in the talk (and some are just plain wrong). Further, I offer no guarantee that I haven’t misinterpreted something Roger said.
- Address the “problem of complexity” – the “biggest problem in IT”
- Federal IT
-
- $71B in federal IT projects; $47B invested in “at risk” projects
-
- Opportunity cost? (What government can’t do without the projects delivered)
-
- Estimated at 5x; a company would demand 5x ROI on an IT project
- 100% of defense-related projects on the “at risk” list
- Map to private sector
-
- $14T GDP; assume 5% in IT => $700B in IT (? something wrong)
- Assume 33% at risk (no evidence) => $231B in at-risk projects
- Thought: aren’t there already good studies on this stuff?
- Now assume 5x in opportunity cost again => $1.115T
- Back to federal IT
-
- FEA rollout in 2006, specifically to address the problem if at-risk IT projects
- Trend in IT projects considered at risk:
-
- 30% iin 2007; 43% in 2008; 66% in 2009
- Thought: why would anyone think that FEA would address this?
- Epidemiology
-
- In medicine, we assume some common factor when many exhibitions of common symptoms (illness, death)
- How?
-
- Look at all the characteristics of the individuals involved to identify commonality, and assume that it is the common factor or a contribution to it
- What is the common factor for IT risk/failures?
-
- Not geography, industry, methodology, technology
- Roger’s belief: complexity: the only common factor across all failures
- Thought: what are the long-term trends? Are we at a new peak of complexity relative to failures?
- Questions
-
- What’s complexity? all-in: organizational, data schema, code
- My question: presume you consider also organizational complexity as well as systems complexity?
-
- A: Mostly organizational, actually; can rebuild systems
- Is communication the problem?
-
- A: A sympton, not the cause.
- Why not identified sooner? What happens to at-risk projects?
-
- A: Some fail because they run out of money. Some because they don’t meet the needs of the business.
- Can’t build architectural quality attributes (security, as an example) into a complex system. Much harder than doing so for a simple system.
- Complexity
-
- Glass’s Law
-
- For every 25% increase in problem complexity, there is a 100% increase in solution complexity.
-
- (Not stated by Glass, but implied by his “Facts and Fallacies of Software Engineering”)
- If you have a system with 10 functions, how many functions can you add before doubling the complexity? 2 or 3.
- If you double the number of functions in a system, you increase complexity by 8x.
- Implications
-
- Methodologies that work well for small projects don’t work well for large projects.
-
- e.g. agile
- Thought: isn’t the solution to make our “systems” smaller. This is what SOA was about – autonomy.
- Methodologies/frameworks don’t explicitly address complexity, so won’t succeed.
- Questions
-
- Isn’t agile about breaking large projects/systems into small ones?
-
- A: Agile doesn’t tell you how to do that, but if you can conceive small systems/projects, agile be effective.
- Examples of projects/companies that have succeeded?
-
- A: A current client: a state government replacing their IT system. Using “this” methodology to decompose.
-
- Who could respond to a 400 page RFP? Only 3 or 4 firms. Predetermines the solution.
- Problem is lack of cohesion and loss of knowledge? Doesn’t this increase complexity?
-
- A: Problem is when we lose knowledge of complex systems, not the root.
- A: If complexity is managed as a primary concern, the others won’t manifest.
- Doesn’t this imply that we just spend more time on up-front design?
-
- A: Yes, but we need to design explicitly to manage complexity.
- Survivability of requirements/stability of organizations?
-
- A: Also symptoms. Need to address holistically.
- Model for complexity: a function of the number of states a system can be in
-
- A penny has two; two have four (or three?); a six-sided die has 6
- Thought: this is unmeasurable for a software system of any relevance. Does that matter?
- Generally: (number of states)^(number of objects)
- Justifies Glass’s law: if we add functionality, we add variables linearly. If we add variables linearly, we add complexity exponentialy.
- Questions
-
- What’s a database row in this model?
-
- A: <shrug/> Consider database columns as variables.
- If we split up “systems”, we manage:
-
- One system of 12 6-state objects => >2B states
- 2 systems of 6 6-state objects each => < 2 x 45K states
- Glass’s Law
-
- 100 -> 1164 functions => 2048x increase in complexity
- 2 x 582 functions => 2 x 250 complexity measure
- Keep going …
- (Mentions SOA in passing; presumes independence of systems; clearly motivated by previous work on Software Fortresses)
-
- Thought: Estimate independence with autonomy?
- As number of subsystems increases, you reach a complexity minimum, then complexity begins increasing
-
- => need to know when to stop decomposing
- Workflow and management complexity increases – need to address coordination among subsystems
- How to partition? Different complexity curves for each:
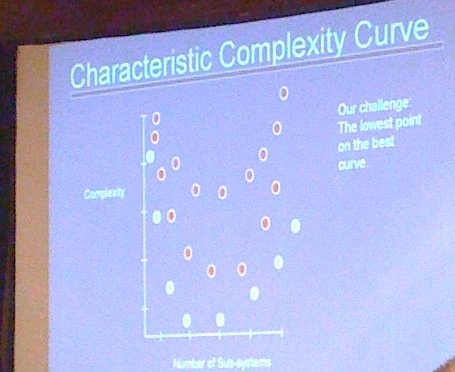
- Goal of architects should be to find the simplest possible solution
-
- Thought: slight misuse of Einstein’s “but no simpler” quote; impossible to be “too simple” in this model, but possible to over-decompose such that simplicity is lost
- Ha: “decibel-driven decision making” – whoever yells loudest
- How do we know which partitioning is simplest?
-
- Equivalence relations
-
- Five characteristics
-
- Binary function: F(x, y)
- Boolean: F(x, y) in {true, false}
- Reflexive: F(x, x) = true
- Symmetric: F(x, y) = F(y, x)
- Transitive: F(x, y) = true ^ F(y, z) = true => F(x, z) = true
- Can drive a unique partition with an equivalence function; e.g. same-category-as
- But can you convince yourself that there’s an equivalence function that is correlated to simplicity?
- Example: synergy
-
- Two functions are synergistic if, from the business perspective, neither is useful without the other
- Perhaps the optimal equivalence relation
- Issue is separating business function and IT realization
-
- Need collaboration between IT and business to get it right
- Process
-
- SIP: Simple Iterative Partitions
- Value proposition: dramatically improves return on IT investment by addressing complexity.
- Thought: a motivation for SOA. Ok.
- Recap
-
- IT complexity is a major problem
- Cannot be solved by existing methodologies
-
- Can’t judge architectures today without building them
-
- Thought: scenario-based assessments (like LAAAM and ATAM) can help
- To solve complexity, must understand it
-
- SOA by itself isn’t the answer, because it pre-supposes a decomposition (?)
- Can only be solved by “best possible” partitioning
- Best partitions are driven by equivalence relations
- SIP is based on best possible partitioning through equivalence relations
- Thought: partitions today are temporal – groups of things built at the same time
- My question: is there stability in the synergy equivalence relation?
-
- Argued not, Roger suggested that its the implementations that change, not the partitions
- Same argument as documented in Enterprise Architecture as Strategy, Motion (Microsoft’s business architecture methodology – unsure of its current state)
- Neeraj Sangal of Lattix: multi-allocation based on equivalence relation?
-
- IT is a problem, because they want to select a single solution (implementation) for multiple business problems. e.g. scheduling, but scheduling of different kinds of things
- Partition: “Autonomous Business Capability”
- Thought: (on my way home) What about on-the-same-P&L-as as an equivalence function? Substantially stable
Welcome Jim!
My VistaPrint colleague, Jim Sokoloff, has started his blog: IT @ A Profitable Dot Com with an excellent first post about VistaPrint’s recent data center move (roughly 8 tons of gear). Jim runs our customer-facing IT organization, but was down there in the trenches with his team moving servers over New Year’s. An awesome reflection of how committed VistaPrint employees are to the success of the business.
Fun with VoodooPad/Outlook integration
I mentioned in a previous post that I’ve been using VoodooPad under Mac OS for taking notes. I like the expressiveness of the wiki paradigm for managing my own jumble of meeting notes, random thoughts/ideas and formal preparation for presentations and documents: naturally a corpus that contains a lot of interrelated concepts. But, I also mentioned a lingering love for OneNote. One of the specific capabilities of OneNote that I missed when I switched to VoodooPad is the ability to keep tasks in sync between OneNote and Outlook – this is very important, because I manage my workload and plan my days substantially via Outlook tasks.
Here’s my solution. First, I defined a convention for annotating a line in VoodooPad as a task:
- An incomplete task is a line starting with “[ ]” – open/close square brackets with a space between.
- A task that has been transferred to Outlook is annotated with “[/]” – the space is replaced with a forward slash.
- A completed task is annotated with “[*]”.
Clearly more sophistication is possible here, including annotations for due dates, priorities, categorization (I tag tasks extensively, along with email and appointments – more on that in a later post on my Outlook tagging add-in).
Next, I defined a simple exchange mechanism between Mac OS and Windows. In my Dropbox folder there’s a file imaginatively named “todo.txt” that contains a line per task, including the annotation. Dropbox takes care of file synchronization between the environments.
Finally, I implemented the synchronization with Outlook, in two pieces. First: a Python plug-in for VoodooPad that reads todo.txt, then scans all of my VoodooPad pages for task-annotated lines, adding any missing tasks to the file, and updating any changed annotations in VoodooPad. Second: a Windows console app (that should be a tray icon or maybe even a Windows service) that has a FileSystemWatcher keeping an eye on my Dropbox folder. When todo.txt changes, the app reads the file, adds any “[ ]”-annotated tasks to Outlook and updates these tasks with the “[/]” annotation.
The hard part was implementing updates back into VoodooPad. Figuring out the specific incantations required to manipulate the page content via the PyObjC bridge was a long experimental challenge, ultimately resulting in a process of counting characters line-by-line, creating an NSRange representing the string range to replace (thanks to a FlyingMeat sample), doing a replaceCharactersInRange_withString_ on my AttributedString (thanks to a tutorial on Python’s introspection capabilities), then doing a setDataAsAttributedString_ on the page. Whew.
All I have left to do is catch task state changes (i.e. tasks being marked completed) on the Outlook side and do the appropriate updates to todo.txt, and it should be all set. The obvious weakness with this whole approach is implicitly using the text of the task as the key, but I very rarely, if ever, alter this once a task is created.
UPDATE: A colleague suggested I include this picture illustrating my solution. And I guess I should consider using the todo.txt format for my todo.txt file.


leave a comment